By: Tom Murray | Managing Director
Customer lifetime value (LTV) is one of the most important metrics that all businesses share. If you do not know what your customer LTV is, then you will not know how much you can spend on a customer to acquire them profitably. It is true that many businesses spend quite a bit to acquire a customer, more than even the first sale cost, but they are only able to do that because they know in the long run how much that customer is likely to be worth.
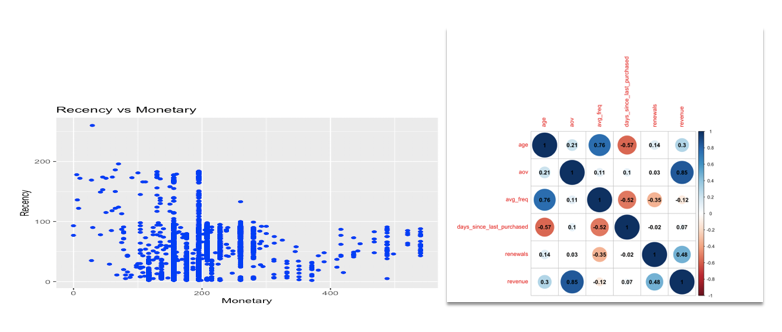
LTV can be calculated in a variety of ways. There are many ways to do this, using RFM Modeling (reach, frequency, monetary modeling), Decision Trees, Random Forests, and a bunch of others. However, most marketers don’t tend to go down into the statistical rabbit hole that can happen with any of these models.
The easiest way to calculate it simply is with the three below inputs.
- Gross profit margin of a customer: This can be calculated as the total average value of of a customer’s orders multiplied by the profit margin of your the business. For example, if the average order value is $100, and the average person buys 3 times in their lifetime, that would be a $300 customer value. If your margin is then 50%, you would be working with a $150 customer LTV. Forgetting to include your margin in an LTV calculation is an easy way to confuse the metric, and overspend to acquire new customers.
- Retention rate: This is simply the percentage of customers that come back over a given time period (typically one year). This can vary from business to business, but the higher the rate the better. Let’s assume for this example your retention rate is 50%.
- Discount rate: Often forgotten about in LTV calculations since many marketers weren’t finance majors, the discount rate is the interest rate used in calculating the present value of the future cash flows, since dollars earned in the future are not worth as much as that same amount would be today (due to inflation, ability to re-invest, etc). This rate can vary from business to business, typically anywhere from 5-15%, so we will use 10% for our calculation below.
Now that you know the inputs of the equation, you can write out the equation as:
Gross Profit Margin X ((Retention Rate) / (1 + discount rate - retention rate))
In this fictitious example, the formula would then look like:
$150 X ((0.5) / (1 + 0.1 - 0.5)) = $125
Many people would not have gone to this length, and just simply taken the gross margin of the customer (AOV x Purchase Frequency X Profit Margin), but that only works if your retention rate is 100%, which 99.99% of businesses do not have. So while all customers may be worth $150 in terms of margin, after accounting for the churn of your users, you need to account for this, making your customer LTV lower.
While the above was a simple example to illustrate LTV, it is unfortunately not that simple, and no customer is created equal to another one. This means that having a single static LTV calculation can likely lead you astray, as you likely have different groups of customer segments that spend and churn at different rates. Let’s take a look at a recent example from Blue Apron, where LTVs can be drastically different for two customer segments.
Blue Apron, one of the pioneers in the meal kit space that set off an extremely competitive battle between tens of different brands trying to gain space in every millenial’s refrigerator. Blue Apron for a few years was operating on its own, with little competition, gaining a loyal customer base. However, competitors started entering the market, and tried to undercut Blue Apron in price, which meant offering discounts to try to attract new customers. Coupons are great because they drive action, but in an LTV case, they could be a big detriment.
As you can see below, the two yellow lines are two different segments - with the high loyalty segment being their original customer base, that were not brought in on a first-time order coupon, while the bottom yellow line is the customer segments of those brought in on a heavy discount (i.e. $60 off your first 2 meal orders).
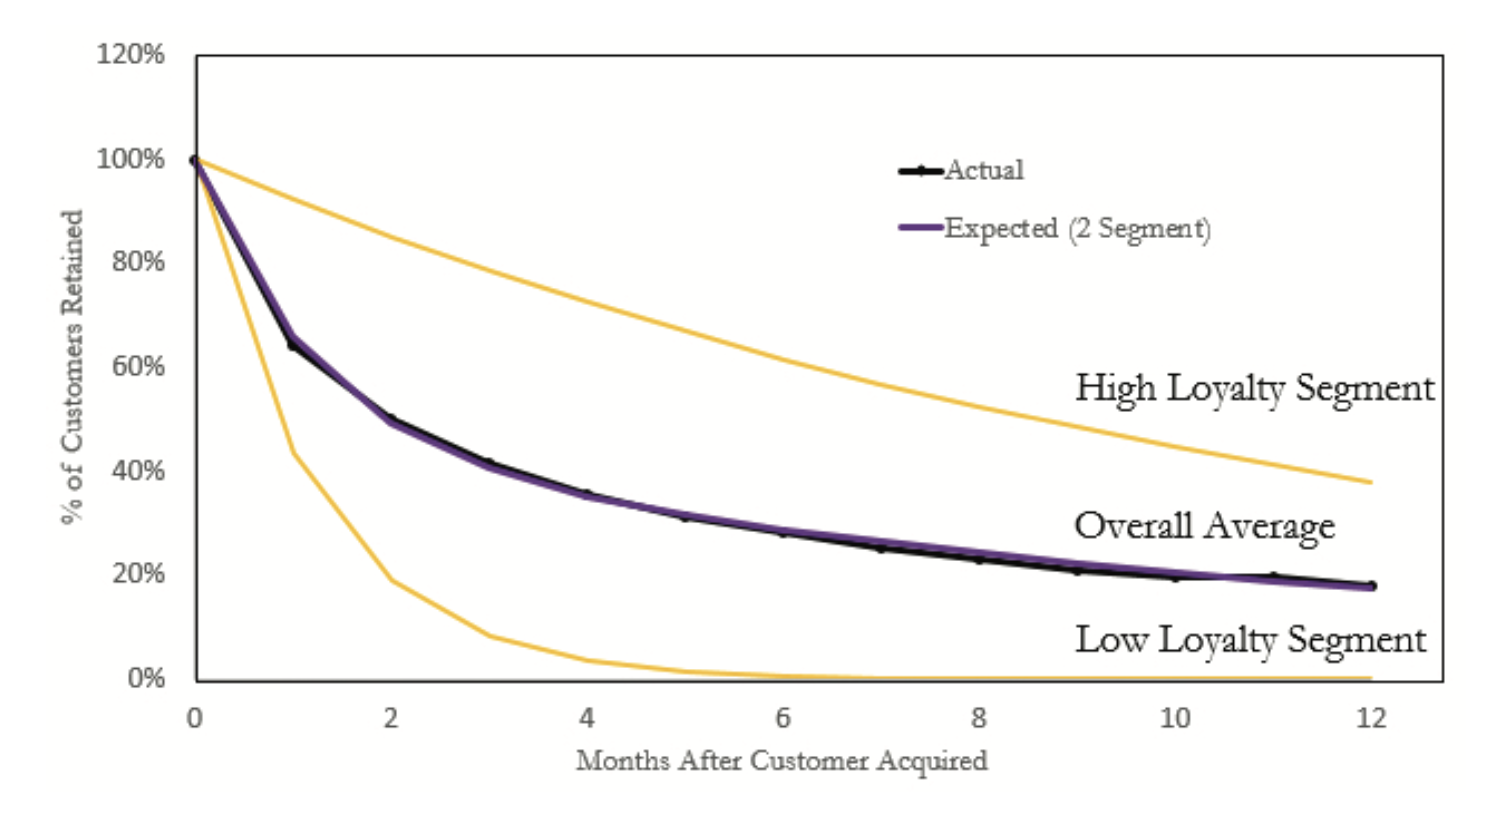
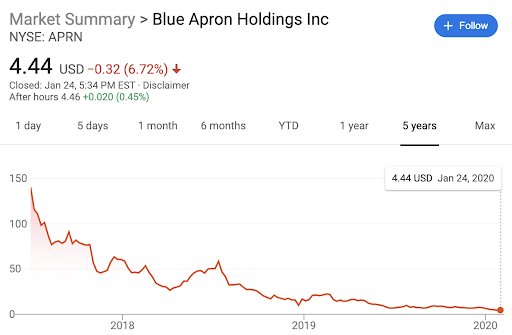
The high loyalty segment does not churn at the same rate, meaning that they are slower to churn and also likely to be a customer for longer. The coupon segment though nearly all dropped after the orders became full price. If Blue Apron were to calculate their LTV as the average black line, they would likely be overpaying for their customers and lose money. Spoiler alert, their stock price used to be around $150 in 2017, but in 2020 trades at under $5 per share.
Customer lifetime value is becoming more and more important, as more brands realize how crucial it is to understand their customer base and how much they can pay to acquire customers and actually make money in the long run. As businesses start focusing on profitability instead of maximum growth, understanding this curve will be a necessity.
In a future blog post, we’ll talk about some of the ways you can act on your LTV reporting to guide your decision making.